I recently discussed Iterative Defense and the Intruder’s Dilemma to introduce the concept of the benefits of a feedback loop in defense. This post describes at a high-level what that architecture looks like and provides an example that we’ll work towards in future posts. My goal is to move from the theoretical to an actual implementation. Much of this post also introduces tools you may not be familiar with. I will write more in-depth articles on what these tools do, why I chose them (as there are strong alternatives to most of these tools), and how to use them. The architecture and tools I’ll show were chosen to be highly scalable so that this setup can work on not only a small test network, but also on global networks with hundreds of thousands of hosts.
Generic Architecture
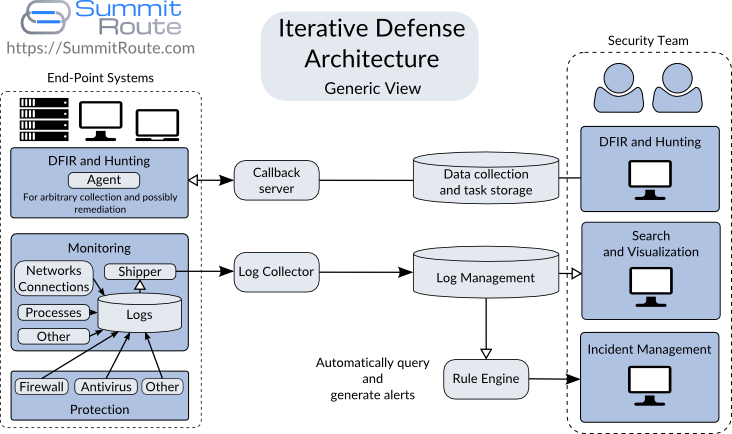
Figure 1 shows the generic features of the architecture for the Iterative Defense model.
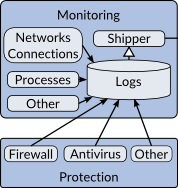
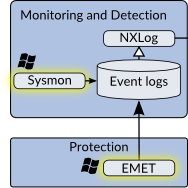
Beginning in the lower left corner of Figure 1, we have tools to perform protection and monitoring on the host. Figure 2 shows an isolated view of these tools. These tools log what they detect and block. The monitoring tools record network connections made, new processes, new devices attached to the system, user logins, or anything else of interest. The protections tools record mitigations performed by the host firewall, anti-virus, anti-exploit, white-listing, or any other defenses. Whenever these defenses stop something from happening, they log that activity.
These local logs get shipped off to a log collection server. This is a one-way street where the collection server just passively snarfs up all the logs given to it. As the log collection server receives logs, it parses these and inserts them into a Log Management system, which is basically a database.
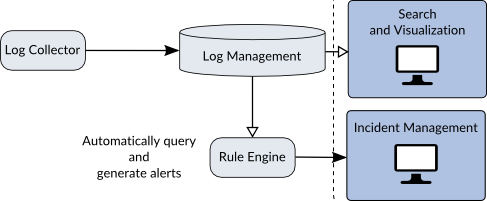
At the bottom of the diagram you can see the Rule Engine which queries the database to receive information about the latest events and then generates alerts. These alerts feed into the Incident Management system which notifies the Security Team that something of interest has happened. This will also act as a ticketing system and provides an interface for the Security Team to add data about the incident as they investigate it.
One of the ways they investigate incidents is via the Search and Visualization features provided by the Log Management system. This allows them to see other logs from this host or look for similar activity on other hosts. This lower right corner shown in Figure 3 is normally referred to as a SIEM. I’ve broken it up to better understand the pieces later.
Once the Security Team starts respondng to an incident, they may then decide that more information is required. They can then use an agent based system to further inspect one or more hosts. Agents are software run on hosts that can receive and act upon requests to pull back more data. Normally they periodically beacon out to a server in order to push agent-specific events and to ask for new tasks. These tasks might involve collecting a copy of a process file, scanning memory, updating the agent itself, or other activities. Once the Security Team has more knowledge of the attack, they can hunt for it on other systems. Figure 4 shows an isolated view of the agent-based system.
Using means outside of the scope of this diagram, the Security Team could remediate the problems (ex. image systems) and update their monitoring and protection systems in order to better detect or block this attack in the future.
There are a couple of important points about this:
- Looking through the logs and hunting across the end-points can be done at anytime by the Security Team. When a new threat is learned about, they can search through their old logs for evidence of it.
- Much of this can be automated with more advanced rules from the rule engine to automatically queue a task to an agent to collect additional information.
- This technology exists today and is free, with much of it being open-source.
Sample Architecture
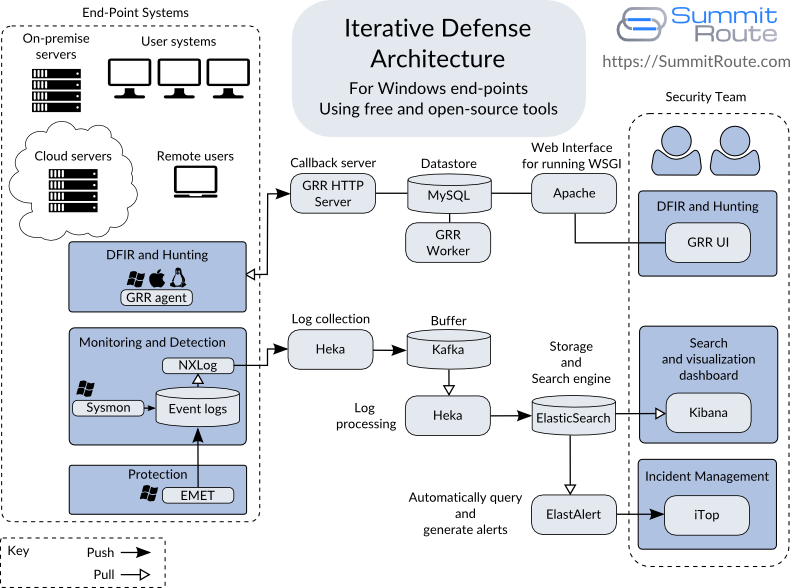
Now that we know what we want to create, lets choose to the tools to build it! Figure 5 shows a diagram of specific tools and how they all fit into the original diagram shown in Figure 1. This is only a subset of a complete security system, but it is a complete flow for some examples that will be discussed in later posts. Specifically, this architecture is focused on Windows end-points. You would need different tools to monitor and protect Linux and Apple OS X systems and to monitor network devices, but other than EMET and Sysmon, this architecture can be applied to any environment.
This diagram shows not only how these tools fit together, but should also help you understand how to scale this system, as each component can live on more than one host for performance and high-availability.
Many of these you may not have heard of before so the rest of this post will explain what they are.
EMET and Sysmon
Starting in the lower left corner again, for our protection and monitoring tools I’ve only listed EMET and Sysmon which are each from Microsoft. Of every tool listed, these are the only ones that are not open-source. They are each free, but do not come with Windows by default.
EMET provides a variety of anti-exploitation defenses for protection. When these protections detect or mitigate an exploitation attempt they will generate alerts. These are sent to the Windows Event Log, which is part of the operating system.
Sysmon can be configured to monitor for a variety of events which it will record to the Windows Event Log. These events include:
- Hashes of new processes created, including full command line for the current and parent process.
- Hashes of drivers and DLLs loaded.
- IP addresses, port numbers, and hostnames for network connections.
- Changes in file creation time, which is commonly used by malware to cover it’s tracks.
NXLog
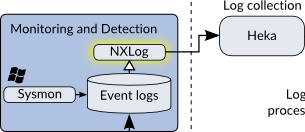
NXLog is an open-source log shipper for Windows from a company called NXLog. It’s purpose is to gather the Windows Event Logs and ship them off the system to Heka, which we use as our Log Collection service. I hope one day to use Heka on Windows in place of NXLog, but Heka isn’t capable of reading the Windows specific Event Logs directly yet.
Heka
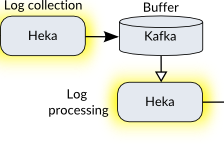
Heka is a tool for high performance data gathering, analysis, monitoring, and reporting that was released by Mozilla in 2013. We use it in two places:
- To receive logs from all end-point systems and shuttle them off to Kafka.
- To pull log data out of Kafka and insert it into ElasticSearch.
The Log Management stack described is basically the ELK stack (ElasticSearch, Logstash, Kibana), except I’m using Heka instead of Logstash. I’ll discuss why in another post, but basically it comes down to Logstash being harder to use and less performant than Heka. I’ll also admit I’m partial to Heka because it’s written in Go, while Logstash is written in JRuby, which is a Java implementation of Ruby.
Kafka
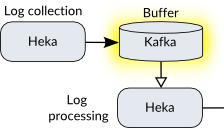
Apache Kafka was originally developed by LinkedIn. It is a message broker (ie. a pub-sub system) for low latency, real-time data. It’s sort of like RabbitMQ and other queuing systems, but focused on streaming log data and being able to scale easily. Kafka is being used as a buffer so that the first Heka instance can simply receive logs as fast as possible and hand them off without needing to worry much about traffic spikes. If you run this architecture on a smaller network, you can leave Kafka out and use a single Heka instance.
ElasticSearch and Kibana
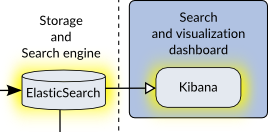
ElasticSearch and Kibana are developed by a company called Elastic. ElasticSearch is an easily scalable database focused on storing and indexing arbitrary text with some additional functionality to make it well-suited for our needs. Kibana is simply a front-end webapp that makes it easy to search and display the data stored in ElasticSearch.
ElastAlert and iTop (or Mozdef)
ElastAlert is a recently released framework from Yelp to allow you to write rules that will be queried against ElasticSearch and generates alerts. These “alerts” can mean a command is run that interacts with the Incident Management system to create a new incident ticket.
iTop is an open-source project for Incident Management and more from a called Combodo. I suspect many readers will use some other option here, but I wanted to stick to only free and open-source tools for this series. A paid alternative would be JIRA with it’s Service Desk component, which is only $20 for that entire setup if you only have 3 users (but shoots up to $1500 when you add a fourth user). Another alternative is the SaaS solution PagerDuty.
A lot of tools can act as incident management ticketing systems, but an important requirement is that unresolved, or unacknowledged, tickets can automatically escalate. For this reason, redmine, JIRA alone, and many other issue tracking systems are not as capable for this task.
iTop is not related to ElastAlert other than that ElastAlert can generate alerts that feed into iTop (with some work). I put these two together though because there is another project called MozDef from Mozilla that combines the functionality of a rule engine run against ElasticSearch along with an incident management interface, and this tool is specifically focused on security incidents. Figure 12 shows how our architecture would look with MozDef used instead.
GRR
GRR is the agent system we’ll use. GRR was developed by Google after Operation Aurora which was a series of attacks from China into a number of US companies, including Google, in 2010. GRR was open-sourced in 2011, and has been actively developed since then. GRR’s focus is on being able to do remote live forensics and incident response across many systems. It has been publicly mentioned that it runs in production on at least 100K+ systems at Google and is also used by Yahoo. It uses a fork of Volatility called Rekall (maintained by Google) for memory forensics and Sleuthkit for file system forensics. It has a lot of sophisticated capabilities built-in and could be leveraged to do more than just incident response.
As GRR is an entire system, I showed it’s major components to help you understand how you might scale it.
Final Thoughts
Hopefully this article has given you a general idea of how various open-source infosec tools can all fit together. Later posts will show specifically how to setup and connect these tools and more, so follow me on twitter (@SummitRoute) and add my RSS feed.
