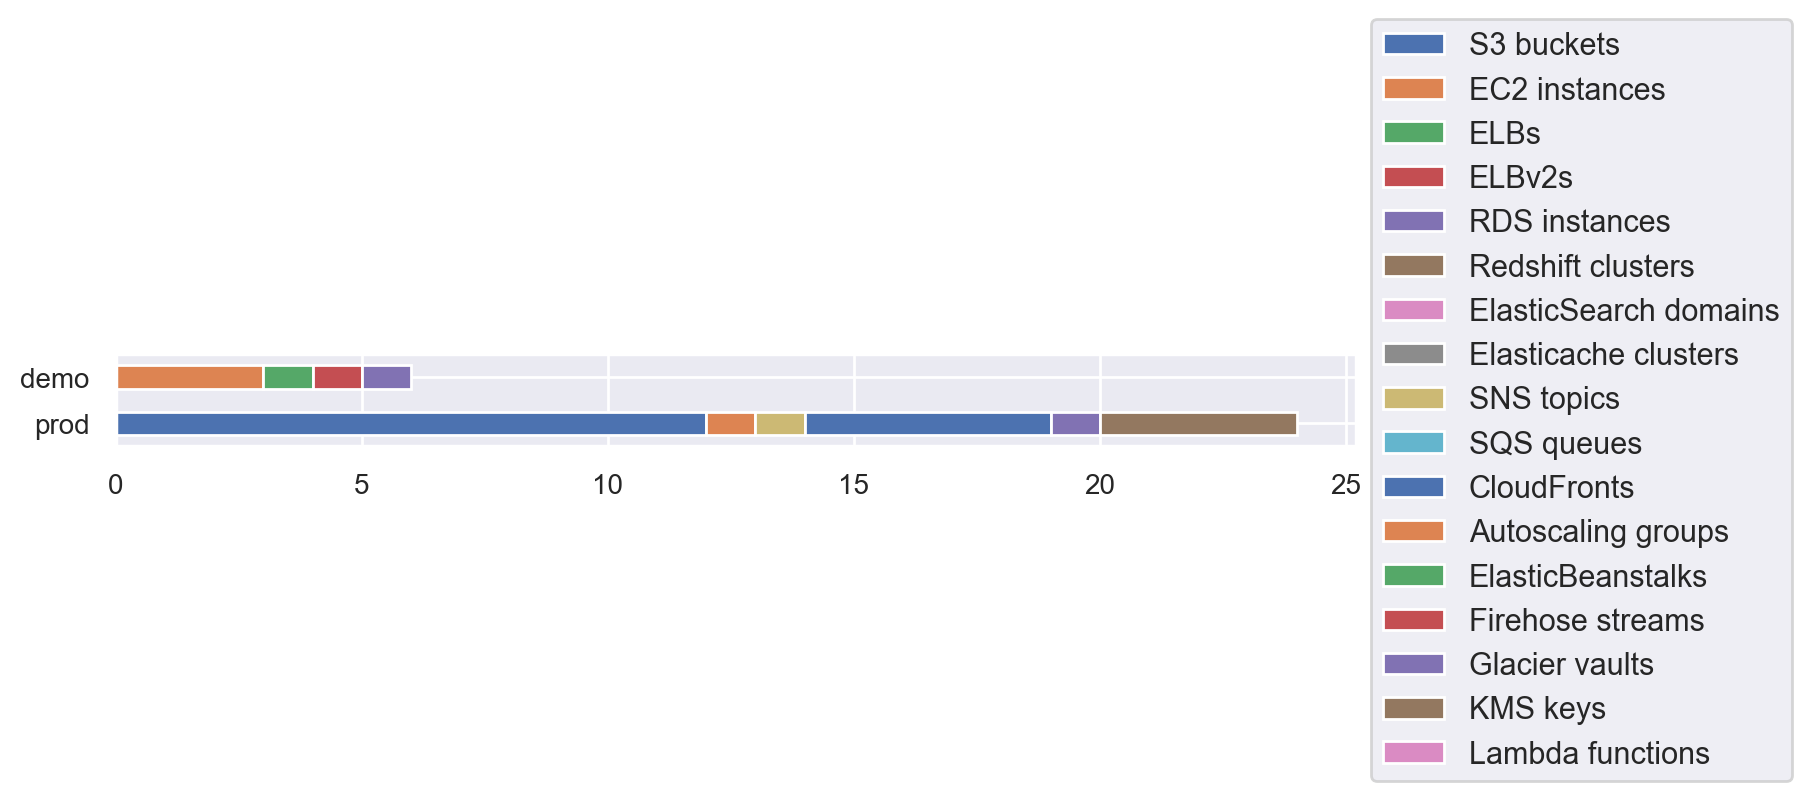
A few months ago I introduced the stats command to CloudMapper that displayed a simple table of the counts of resources in an account. Recently, I’ve added the ability to see this information as a chart.
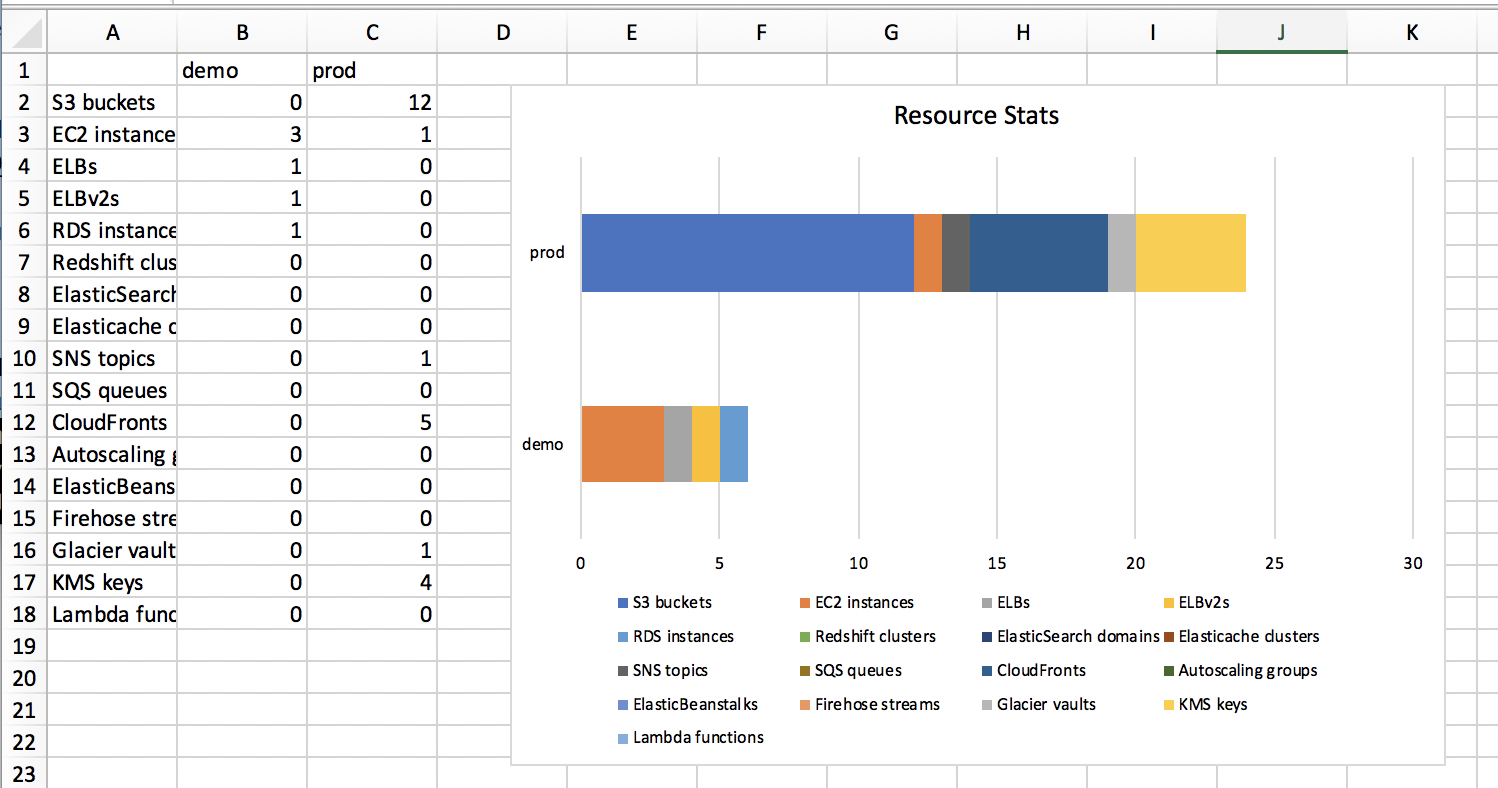
Previously you could load the stats output into Excel and generate a chart, but this automates that process.
This addition helps you understand the relative “sizes” of the accounts much more quickly, and generate nicer looking reports. I also greatly reduced the amount of things that the stats command was counting to help make this more understandable.
Custom commands
The stats command and this new graphing code is easily extendable if you want to get stats and charts for other resources, such as number of IAM users. You can make your own custom command by copying https://github.com/duo-labs/cloudmapper/blob/master/commands/stats.py locally and renaming it to commands/iam_stats.py. Change the resources variable to:
resources = OrderedDict([
    ('user', {
        'name': 'IAM users',
        'query': '.UserDetailList|length',
        'source': 'iam-get-account-authorization-details'}),
    ('role', {
        'name': 'IAM roles',
        'query': '.RoleDetailList|length',
        'source': 'iam-get-account-authorization-details'})
])
Then to get a table and chart of the users in the account, you’d call your new command with: python cloudmapper.py iam_stats --accounts demo,prod


